Table of Contents >> Show >> Hide
- The Atlanta Fed’s GDPNow: The Thermometer That Updates Mid-Sneeze
- So Why Is the “Red-Hot” Economy Shivering?
- What the Hard Data Says Right Now
- 1) Inflation: Cooling… but not “mission accomplished”
- 2) Jobs: Still growing, but hiring is cautious
- 3) Spending: Resilient, but more selective
- 4) Manufacturing and production: Not dead, not booming, just… working
- 5) Housing: The affordability bruise is still tender
- 6) Small business: Busy, but nervous
- 7) Confidence: The vibes are down (even when GDP is up)
- The Fed’s View: “Solid Pace,” But No Victory Lap
- Three Reasons GDPNow Can Give You Whiplash
- Does “Shivering” Mean Recession?
- How to Read GDPNow Like a Grown-Up
- What to Watch Next (Without Doomscrolling)
- Conclusion
- Real-World Experiences: What the “Shivers” Feel Like on Main Street
If you’ve ever checked the Atlanta Fed’s GDPNow page and felt your stomach do a little somersault, congratulations: you’ve experienced “nowcast whiplash.” One day the U.S. economy looks like it’s sprinting in fresh sneakers. The next day it’s wearing a puffer jacket indoors, clutching a mug that says “World’s #1 Recession Alarmist.”
The truth is less dramaticand more useful. GDPNow is a fast, data-driven estimate of real GDP growth for the current quarter. It’s not a crystal ball. It’s more like a thermometer that updates mid-sneeze. And when the economy has been “red-hot” (strong growth, resilient spending, and a labor market that refuses to tap out), even a small dip in incoming data can feel like the whole vibe just changed.
In this article, we’ll translate the “shivers” into plain English: what GDPNow is actually saying, why it can swing hard, what the freshest official data implies, and how to read all of it without doomscrolling yourself into a productivity crater.
The Atlanta Fed’s GDPNow: The Thermometer That Updates Mid-Sneeze
GDPNow exists for one big reason: official GDP arrives with a delay. So the Federal Reserve Bank of Atlanta built a model that continuously updates a GDP estimate as new data prints hit the tape.
What GDPNow is (and isn’t)
GDPNow is a “nowcast”a running estimate of real GDP growth for the current quarter, updated as new economic releases appear. The Atlanta Fed is explicit about two guardrails: it’s not an official forecast, and it makes no subjective adjustments. It’s math doing math.
That matters because the model can look overly confident when the data is noisy. But it can also be an early warning that the mix of consumption, trade, inventories, and government spending is shiftingsometimes quickly.
So Why Is the “Red-Hot” Economy Shivering?
“Shivering” is what happens when the story changes from “everything is powering ahead” to “growth is uneven, and the trend is cooling.” That doesn’t require a recession. It can be as simple as: consumers still spending, but more selectively; hiring still happening, but slower; inflation easing, but not fully behaving; and interest rates still restrictive enough to make big purchases feel like signing up for a long-term relationship.
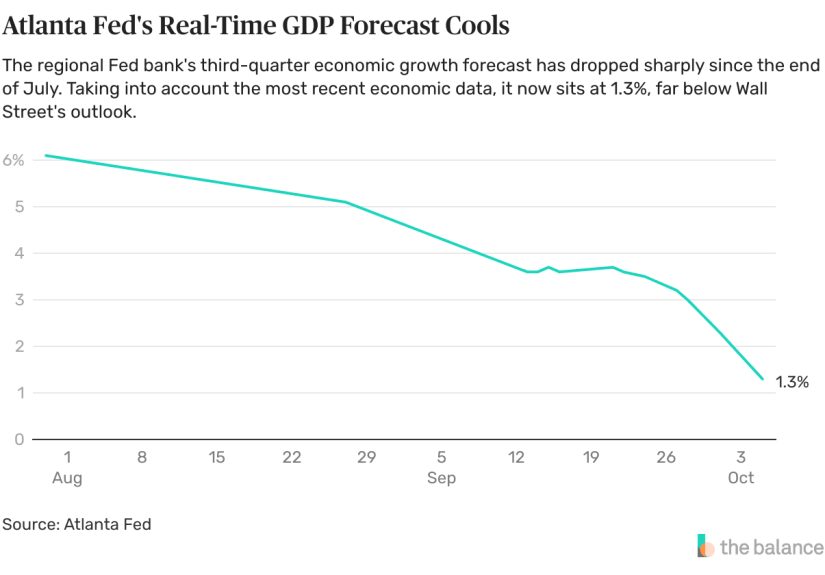
Growth cooled, then the model bounced
Here’s a real-world example of why people obsess over GDPNow. The Atlanta Fed’s latest published GDPNow estimate showed 3.1% annualized real GDP growth for 2026:Q1 (as of February 20, 2026). That reads like a “solid start to the year” headline generator.
But step back one quarter and you see why the mood can shift: the Bureau of Economic Analysis reported real GDP growth of 1.4% annualized in 2025:Q4, a noticeable slowdown from the prior quarter. In other words: hot, then not-so-hot, then “maybe warming back up.” Welcome to macro.
A key point: GDPNow can be strong even while people feel anxious. Households experience prices and payments, not annualized GDP equations. You can have positive growth and still feel like the economy is side-eyeing your budget.
What the Hard Data Says Right Now
If GDPNow is the fast thermometer, official data is the lab result. The two should talk to each other. Here are the “big pillars” that explain why the economy can look both sturdy and shivery at the same time.
1) Inflation: Cooling… but not “mission accomplished”
The Consumer Price Index (CPI) showed inflation easing compared with the scary peaks of a few years ago. In January 2026, CPI rose 0.2% over the month and was up 2.4% over the year. Core CPI (excluding food and energy) rose 0.3% over the month and 2.5% over the year.
That’s progress. But “somewhat elevated” is still the vibe in Fed language. And for households, the level of prices matters. Even when inflation cools, many people still feel the earlier jump every time they buy groceries or renew insurance.
2) Jobs: Still growing, but hiring is cautious
The labor market remains a key reason recession calls keep getting delayed like your friend who says “leaving now” while still in their pajamas. In January 2026, total nonfarm payroll employment rose by 130,000, and the unemployment rate was 4.3%.
Those numbers don’t scream “collapse,” but they do match the broader theme: job gains are lower than the boom period and firms are careful. That carefulness shows up in fewer openings, slower hiring, and more “let’s see how Q1 goes” energy inside HR departments.
3) Spending: Resilient, but more selective
On the consumer side, the signals are mixed in a very human way. Retail and food services sales were reported as virtually unchanged from November 2025 and up 2.1% from a year earlier (December 2025). That’s not a spending freezebut it’s not a “YOLO shopping cart” moment either.
Meanwhile, BEA’s personal income and outlays report showed that the PCE price index increased in December 2025 and reported the year-over-year readings investors obsess over. This is the kind of data that can nudge GDPNow around: strong nominal spending can coexist with softer real spending once you account for prices.
4) Manufacturing and production: Not dead, not booming, just… working
The factory economy matters because it tends to feel stress earlier. The ISM Manufacturing PMI registered 52.6 in January 2026above 50, which indicates expansion, but not exactly “champagne and confetti.”
Industrial production added another “steady-ish” signal. The Federal Reserve reported industrial production increased 0.7% in January 2026, with manufacturing output up 0.6%. That’s a decent month and suggests the goods side isn’t rolling over.
5) Housing: The affordability bruise is still tender
Housing is where high rates feel the most personal. The NAHB/Wells Fargo Housing Market Index showed builder confidence at 36 in February 2026 (down one point), with NAHB pointing to persistent affordability challenges like high price-to-income ratios and elevated land and construction costs.
Builders also reported ongoing incentives and some price cuttingsigns that demand exists, but the buyer is pickier and the monthly payment is the bouncer at the door.
6) Small business: Busy, but nervous
Small firms often spot turning points early because they don’t have the “absorb losses for eight quarters” cushion. The NFIB Small Business Optimism Index rose to 99.3 in January 2026, while uncertainty also moved higher. Translation: many owners still see opportunity, but they’re not placing huge bets with their eyes closed.
7) Confidence: The vibes are down (even when GDP is up)
If you want a clean example of “people feel worse than the macro data looks,” consumer confidence is your exhibit A. The Conference Board reported the Consumer Confidence Index fell sharply in January 2026 to 84.5, and the Expectations Index dropped to 65.1 (below a level that historically can signal recession risk ahead).
University of Michigan survey results echoed the gloomy mood. Final February 2026 consumer sentiment edged up to 56.6but remained well below year-ago levels. People can keep spending while simultaneously telling surveys “I do not like this, actually.”
The Fed’s View: “Solid Pace,” But No Victory Lap
The Federal Reserve’s official communications put the economy in a careful balance: growth is solid, the labor market has stabilized somewhat, and inflation has cooled but isn’t at target in a way that invites celebration.
In the January 28, 2026 FOMC statement, the Fed said economic activity has been expanding at a solid pace and held the federal funds rate target range at 3.5% to 3.75%. Two members dissented in favor of a quarter-point cut. That’s a meaningful detail: policy is not only about the level of rates, but also the debate about how restrictive policy still is.
The minutes from that meeting add texture that helps explain “shivers.” Many participants cautioned that progress toward the Fed’s 2% inflation goal could be slower and more uneven than expected, and they judged the risk of inflation staying persistently above target was meaningful. The minutes also describe businesses expecting to raise prices due to cost pressures (including tariffs), and note a labor market that looks like it’s stabilizing after gradual coolinglow layoffs, but also low hiring.
In plain English: the Fed isn’t panicking, but it isn’t relaxing either. That tensionsolid activity plus sticky riskscreates conditions where nowcasts can bounce around as each data release either supports “soft landing” or whispers “not so fast.”
Three Reasons GDPNow Can Give You Whiplash
If you’ve ever wondered why a single report can move GDPNow enough to make social media declare “recession tomorrow,” these are the usual suspects.
1) Inventory math is weird (and powerful)
Inventories are one of the least intuitive parts of GDP. If businesses build inventory, GDP can rise even if final demand is meh. If businesses run down inventory, GDP can look weaker even if consumers are still buying. GDPNow responds quickly when inventory-related data changesso a boring warehouse story can turn into a dramatic GDP headline.
2) Trade and government can swing the story
Net exports and government spending can flip quarter-to-quarter. That’s one reason you should treat “headline GDP” like a movie trailer, not the full film. The BEA’s GDP release for 2025:Q4 specifically noted a drag from a decrease in government spending that reflected certain timing and shutdown-related effects. That’s not a “the economy forgot how to grow” story; it’s a “components matter” story.
3) Data revisions are the economy’s plot twist
Many indicators get revised. GDP itself gets revised multiple times. A nowcast updates in real time, but it’s building on inputs that can change. That’s not a flaw; it’s the reality of measuring a 330-million-person economy using imperfect snapshots.
Does “Shivering” Mean Recession?
Not automatically. “Cooling” can be the intended outcome of higher interest rates: slower demand growth, fewer inflation pressures, and a labor market that’s less overheated.
That said, the shivers are worth taking seriously when they show up across multiple pillars at once:
- Confidence drops hard (like January’s Conference Board slide) while discretionary spending starts to soften.
- Hiring freezes broaden beyond a few sectors, and unemployment rises meaningfully.
- Credit conditions tighten and delinquencies accelerate, pressuring households and small businesses.
- Inflation stops improving, forcing the Fed to stay restrictive longer than the economy can comfortably handle.
Right now, the data looks more like an economy that’s downshifting than derailing: inflation is lower than recent peaks, job growth continues, production is expanding, and GDPNow is tracking growth for Q1. But the confidence numbers remind us that households are sensitive to prices and paymentsand that sentiment can turn into behavior if conditions worsen.
How to Read GDPNow Like a Grown-Up
Here’s the simplest way to use GDPNow without letting it ruin your afternoon:
1) Treat it like a “live estimate,” not a prophecy
GDPNow is most helpful as a directional signal. If it’s trending down across multiple updates, something real is happening in the data. If it jumps around after single releases, it may just be the model doing what it was designed to doreact quickly.
2) Watch the “why,” not just the headline number
Ask: is the change driven by consumer spending, business investment, inventories, or net exports? A dip caused by inventories can feel different than a dip caused by weakening consumption.
3) Compare it with other “reality checks”
Pair GDPNow with CPI/PCE inflation, payrolls, retail sales, and confidence. A single metric is a mood. A pattern across metrics is a story.
4) Zoom out to the trend
The economy doesn’t live quarter-to-quarter; people do. If the broader trend shows cooling inflation, slower but positive job growth, and steady production, then a “shiver” might just be the economy changing lanesnot slamming the brakes.
What to Watch Next (Without Doomscrolling)
If you want a clean dashboard that keeps you informed without turning you into a full-time amateur economist, prioritize:
- Inflation prints (CPI and PCE) for the direction of disinflation.
- Jobs data for whether “low hiring” becomes “higher unemployment.”
- Consumer spending (retail sales and real consumption) for signs the engine is stalling.
- Housing and small business as early indicators of rate pressure.
- GDPNow updates as a quick read on how the incoming data is mapping into GDP components.
Conclusion
The “red-hot economy” doesn’t have to flip into recession for GDPNow to send a chill through headlines. GDPNow is designed to respond quickly, and the U.S. economy in early 2026 is delivering the kind of mixed signals that produce dramatic updates: slower quarterly growth recently, inflation improving but still a worry, hiring continuing but cautious, and confidence that’s frankly not vibing.
The best takeaway isn’t “panic” or “party.” It’s precision. Watch the components. Track the trend across multiple indicators. And remember: a nowcast is a tooluseful, imperfect, and absolutely not a substitute for thinking.
Real-World Experiences: What the “Shivers” Feel Like on Main Street
Economic data can feel abstract until it collides with your actual Tuesday. So here are the kinds of experiences people report when the economy is still growing, but “shivering” a bitwhen the expansion is real, yet everyone is acting like they heard a suspicious noise in the basement.
1) The “my paycheck is fine, but my cart is not” moment. A lot of households aren’t experiencing a dramatic income crash. Jobs exist. Hours are stable. But prices that rose sharply in prior years still live at a higher level. That means even as inflation cools, the weekly total at the grocery store can feel stuck on “rude.” People respond by trading down: store brands instead of name brands, chicken thighs instead of boneless breasts, one streaming service at a time instead of five. The economy can keep growing while consumers quietly optimize every line item.
2) “We’re not laying people off… we’re just not hiring.” This is classic late-cycle behavior. Businesses don’t see demand collapsing, but they’re not confident enough to add headcount aggressively. You’ll hear: “Let’s see how spring looks,” “We’ll use contractors,” or “We’ll backfill only the must-have roles.” For job seekers, it can feel like the market is still functioningjust with fewer open doors and longer interview cycles. That aligns with a labor market that stabilizes through low hiring rather than mass layoffs.
3) The housing reality check. If you’re shopping for a home, “shivers” can feel like being rejected by a monthly payment. The buyer may be qualified and employed, but the payment math is unforgiving. Builders respond with incentivesrate buydowns, upgrades, small price cutsbecause demand exists, but affordability is the bouncer. Renters experience a different version: renewals that still bite, insurance and maintenance costs creeping up, and the sense that “easing inflation” isn’t the same as “lower bills.”
4) Small businesses doing okay… while thinking about worst-case scenarios. For a restaurant, it might mean weekends are full but weekday lunch is soft. For a home services business, it could mean plenty of repair calls but fewer “let’s remodel the kitchen” projects. For a retailer, it’s customers buying necessities but spacing out discretionary purchases. Owners still see revenue, but they obsess more over cash flow, inventory, and financing terms. That’s why optimism can rise even as uncertainty also risespeople see opportunity, but they keep a hand on the emergency brake.
5) Investors and savers living in two worlds. Some households feel better insulatedespecially those with sizable assets or higher incomes. Their experience can be “my job is stable and my portfolio is fine,” even if they complain about prices. Meanwhile, households without that cushion feel every payment. This creates an economy that can look strong in aggregate (spending doesn’t collapse) while confidence surveys stay depressed (a lot of people feel squeezed).
6) The “I’m tired of uncertainty” vibe. Even when the economy grows, uncertainty itself is a cost. Businesses delay expansion. Families delay moves. People postpone big purchases. That caution can cool growth without creating a dramatic crashexactly the kind of environment where GDPNow can wobble and headlines can sound scarier than the underlying reality.
Put all of that together and “shivers” makes sense: the economy isn’t necessarily freezing, but it’s not lounging in a heat wave either. It’s functioningsometimes impressivelywhile a lot of people behave like they’re walking across an icy sidewalk: carefully, slowly, and with a strong preference for shoes that won’t slip.