Table of Contents >> Show >> Hide
- What Is the Dow Jones Industrial Average?
- A Brief History of the Dow
- How the Dow Is Calculated (and Why It’s Weird)
- Who’s in the Dow Today?
- What the Dow Tells You and What It Doesn’t
- Dow vs. S&P 500 vs. Nasdaq: How Does It Compare?
- How Investors Actually Use the DJIA
- Practical Tips for Beginners Watching the Dow
- Real-World Experiences: Learning from the Dow
- Conclusion
If you’ve ever seen a financial news headline that screams “The Dow is up 300 points!” and wondered
whether you should celebrate, panic, or just finish your coffee, this guide is for you. The
Dow Jones Industrial Average (DJIA) is one of the most famous stock market indexes in
the world, but it’s also one of the most misunderstood.
In this article, we’ll break down what the Dow actually measures, how it’s calculated, why investors
still care about it after more than a century, and where its limitations lie. By the end, you’ll be
able to read “Dow” headlines like a pro and understand how this blue-chip stock index fits into the
bigger picture of the U.S. stock market.
What Is the Dow Jones Industrial Average?
The Dow Jones Industrial Average, often shortened to the Dow or
DJIA, is a stock market index made up of 30 large, well-known U.S.
companies. These are often called blue-chip stocksmajor, established businesses
with long operating histories, recognizable brands, and significant influence on the economy.
First created in the late 19th century, the Dow was originally designed to track industrial companies
like railroads, steel, and manufacturing. Today, it’s much more diversified. Its 30 components span
industries such as technology, healthcare, finance, consumer goods, aerospace, and more. The index is
maintained by a committee at S&P Dow Jones Indices, which periodically adjusts the membership to
reflect changes in the U.S. economy, corporate mergers, and shifting market leadership.
Even though the DJIA only includes 30 stocks, it’s widely used as a shorthand for “how the
U.S. stock market is doing.” Financial media, policymakers, and everyday investors
all pay attention to its daily moves, especially when the Dow hits a new record high
or suffers a big one-day drop.
A Brief History of the Dow
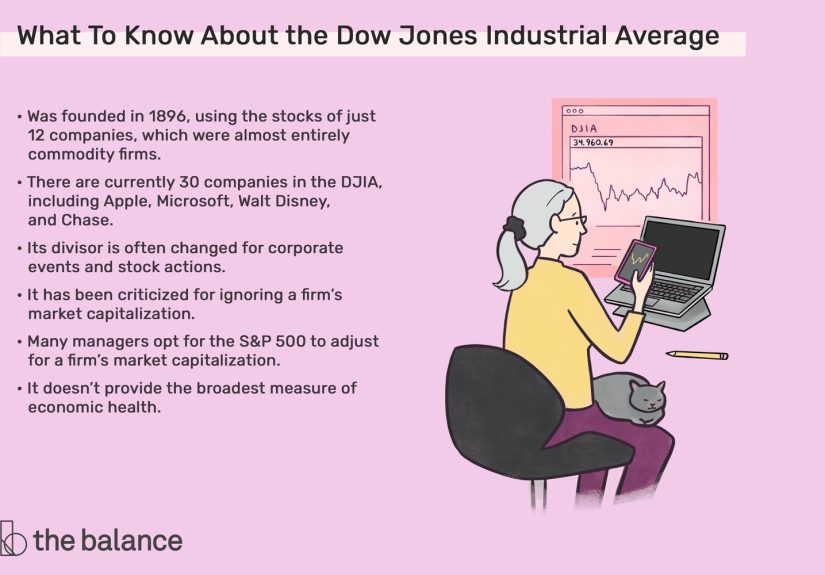
The Dow has serious seniority. It dates back to the 1890s, when Charles Dow (yes, that Dow)
created an index to summarize how leading industrial companies were performing. The earliest version
of the index tracked just 12 industrial stocks, mostly tied to the booming industrial economy of the
time.
As the U.S. economy evolved, so did the index:
- Early 1900s: The index expanded beyond 12 companies as more major corporations
emerged. - 1916 & 1928: The number of components eventually grew to 30, where it stands
today. - Throughout the 20th century: The Dow swapped out companies as old industrial
giants faded and new leaders appearedthink of the transition from railroads and steel to technology,
healthcare, and consumer brands.
Over its lifetime, the Dow has lived through world wars, depressions, recessions, bubbles, interest
rate cycles, and technological revolutions. That long history is one reason it’s still treated as a
major barometer of the U.S. economy and investor sentiment.
How the Dow Is Calculated (and Why It’s Weird)
Here’s where the Dow gets quirky. Most modern stock indexes, like the S&P 500, are
market-cap weighted. That means a company’s influence on the index is based on its
total market value (share price × number of shares outstanding).
The Dow, on the other hand, is a price-weighted index. In simple terms, this means:
The higher a stock’s price, the more impact it has on the Dow’s level.
The basic formula is:
Dow level = (Sum of the 30 stock prices) ÷ Dow divisor
The Dow divisor is a special number that adjusts for stock splits, spin-offs, and
other corporate actions. It ensures that when a company splits its stock (say 2-for-1), the index
doesn’t suddenly plunge just because the share price is cut in half. Over time, this divisor has been
changed many times and is now a small number, which magnifies the effect of each dollar move in the
group of 30 stocks into points on the index.
A Quick Example
Imagine a simplified Dow with just three companies:
- Company A at $100
- Company B at $50
- Company C at $25
The sum of the prices is $175. If the divisor were, say, 0.5, the index level would be:
175 ÷ 0.5 = 350
Now, suppose Company A moves from $100 to $101 (a $1 change). That $1 move alone increases the sum to
$176, making the index:
176 ÷ 0.5 = 352
So the index rises 2 points because one high-priced stock moved up by $1. If the cheaper stock (Company
C at $25) went up by $1 instead, the index would move by the same amount in this simple examplebut in
the real Dow, where prices vary much more widely, a high-priced stock can have a disproportionately
large effect compared with a lower-priced one.
This is why you’ll sometimes hear that a single high-priced Dow component “led the index higher” or
“dragged the Dow down,” even if its market value is smaller than some of its peers.
Who’s in the Dow Today?
The Dow’s 30 components aren’t random. A committee selects them to reflect major parts of the U.S.
economy. While the index was once dominated by industrial names, it now represents a wide mix of
sectors, including:
- Technology: Major software and hardware giants.
- Healthcare: Big pharmaceutical and health-insurance companies.
- Financials: Large banks and payment networks.
- Consumer staples and discretionary: Iconic brands that dominate grocery aisles and
shopping carts. - Industrials and aerospace: Manufacturers, equipment makers, and aviation leaders.
The companies in the Dow are generally profitable, well-established, and influential. When you hear
people talk about “blue-chip stocks,” many of them live inside this index. Membership isn’t permanent,
though. When a company declines in relevance or its industry shrinks in importance, it can be dropped
in favor of a rising star that better reflects the modern economy.
What the Dow Tells You and What It Doesn’t
What the Dow Is Good At
Despite its quirks, the DJIA does a few things very well:
- Simple snapshot: The Dow gives a quick, easy-to-understand view of how many of the
largest, most recognizable U.S. companies are performing. - Historical perspective: Because it’s been around for more than a century, you can
compare today’s levels with past erasGreat Depression, dot-com bubble, financial crisis, and more. - Media-friendly: “Dow up 300 points” makes for a punchy headline. It’s simple
enough that non-investors can follow along. - Blue-chip health check: Since it focuses on big, established companies, the Dow
can hint at how corporate America’s giants are handling economic cycles.
Where the Dow Falls Short
At the same time, you need to know what the Dow doesn’t tell you:
- It covers only 30 stocks. The U.S. stock market includes thousands of publicly
traded companies. The Dow doesn’t capture small-caps, many mid-caps, or even all mega-caps. - It’s price-weighted, not size-weighted. A company with a high share price but
smaller overall market value can move the index more than a larger company with a lower share price. - Sector representation is limited. The Dow doesn’t include every industry in
proportion to its economic importance. Some sectors are relatively under- or over-represented. - It’s not the best measure for diversification. For long-term investing decisions,
broader indexes like the S&P 500 often give a more complete view of the market.
In short, the Dow is a helpful sentiment indicator and historical yardstick, but it’s
not the onlyor even the most comprehensivetool in an investor’s toolkit.
Dow vs. S&P 500 vs. Nasdaq: How Does It Compare?
To really understand the DJIA, it helps to compare it with the other big U.S. stock indexes:
the S&P 500 and the Nasdaq Composite.
Dow vs. S&P 500
- Number of stocks: The Dow has 30; the S&P 500 has 500 of the largest U.S.
companies. - Weighting method: Dow is price-weighted; S&P 500 is market-cap weighted.
- Market coverage: The S&P 500 is broadly considered a better proxy for the
overall U.S. stock market and is widely used as a benchmark for mutual funds and ETFs. - Volatility and composition: The Dow tends to have more mature, dividend-paying
companies and can sometimes be less volatile in downturns, while the S&P 500 includes more
high-growth names.
Many professional investors look to the S&P 500 first when they want a big-picture view of the
market, but the Dow remains popular because of its history, simplicity, and media visibility.
Dow vs. Nasdaq Composite
- Focus: The Nasdaq Composite is heavily tilted toward technology, growth stocks,
and smaller companies listed on the Nasdaq exchange. - Risk profile: Nasdaq tends to be more volatile, especially during tech booms
and busts. - Story: When you hear that “tech stocks are soaring” or “growth names are getting
crushed,” it’s often the Nasdaq that’s doing the heavy lifting in those headlines.
Put together, the Dow, S&P 500, and Nasdaq give three different lenses on the U.S. stock market:
blue-chip strength (Dow), broad market performance (S&P 500), and tech/growth leadership (Nasdaq).
How Investors Actually Use the DJIA
So what do real investors do with the Dow, besides watching it scroll across the bottom of a financial
TV channel?
A Benchmark, Not a Shopping List
Most people don’t buy all 30 Dow stocks individually just because they’re in the index. Instead, the
Dow serves primarily as a benchmark:
- Portfolio managers might compare their performance to the Dow to see whether their strategy is
beating or lagging major blue-chip stocks. - Long-term investors use it to understand how their retirement accounts are doing relative to a
well-known index.
While you can’t invest directly in any index, there are ETFs and mutual funds that
track the DJIA’s performance, making it easy to get exposure to this group of companies in a single
trade.
A Sentiment and Headline Gauge
The Dow also functions as a kind of market mood ring. A big surge in the index often
signals optimism about corporate profits, interest rates, or economic growth. A sharp drop can
indicate fear about recessions, geopolitical risks, or financial stress.
Smart investors, however, don’t react to every swing. Instead, they use the Dow’s moves as one input
among manylooking at earnings reports, economic data, interest rates, and their own risk tolerance
before making decisions.
Practical Tips for Beginners Watching the Dow
1. Focus on Percentages, Not Just Points
“The Dow fell 300 points” sounds hugeuntil you look at the percentage. A 300-point drop when the
index is above 35,000 is less than a 1% move. Historically, that kind of daily fluctuation is actually
pretty normal for the stock market.
Always translate point moves into percentages to understand whether a move is ordinary noise or a
truly unusual event.
2. Don’t Let Headlines Dictate Your Strategy
Dow headlines are loud, but your financial goals are personal. Retirement savings, college funds, and
long-term wealth all depend more on:
- How much you save
- How diversified your portfolio is
- How patient and consistent you are
The Dow’s day-to-day drama is interesting, but your strategy should be based on years and decades, not
hours and days.
3. Use the Dow as a Conversation Starter, Not the Final Word
The DJIA is great for starting the conversation: “The Dow is up todaywhat’s driving it?” From there,
look deeper: Which sectors are leading? What are interest rates doing? Are corporate earnings
strengthening or weakening?
The more context you add, the more useful the Dow becomes as a tool for understanding the market.
Real-World Experiences: Learning from the Dow
Theory is nice, but most people form their beliefs about the Dow Jones Industrial Average through
real-life experiencessometimes inspiring, sometimes painful, and often a bit of both. Here are a few
common patterns that many investors recognize when they look back on their relationship with this
famous index.
Watching the Dow During Big Market Swings
Many new investors first pay attention to the Dow during a dramatic market event. Maybe it’s a day
when the index drops 1,000 points and the headlines are full of words like “plunge” and “panic.”
Looking back, those moments often feel very different from the inside than they do in hindsight.
In the moment, a big drop can feel like the sky is falling. But when you zoom out over a 10- or
20-year chart, you often see that large down days are tiny blips in a long-term upward trend. Investors
who learned to stay calm during those periodsand perhaps even continued to invest regularlyoften find
that those scary days eventually became some of their best buying opportunities.
Discovering That “Record High” Doesn’t Mean “Time to Bail Out”
Another common experience: the first time you notice the Dow hitting yet another “all-time high.”
It’s tempting to think, “It can’t possibly go higher from here; maybe I should wait for a crash.” But
markets often spend a surprising amount of time close to or at new highs, especially during long
periods of economic growth.
Investors who sit on the sidelines waiting for the “perfect” moment to jump in may discover that the
Dow keeps climbing while their cash sits idle. Over many decades, the biggest reward has usually gone
to people who invested steadily, regardless of whether the index was at a high or a low, rather than
trying to time every twist and turn.
Realizing the Dow Isn’t the Whole Market
A lot of people assume that if the Dow is up, everything is upand if it’s down, everything is down.
Eventually, most investors realize that’s not quite true. There are days when the Dow rises thanks to a
handful of high-priced blue-chip stocks, while smaller companies or different sectors are having a very
different experience.
This often leads to a valuable lesson: diversification matters. Relying only on the
Dow to judge your portfolio’s health can be misleading. Many investors start out tracking only the Dow
and later add the S&P 500, Nasdaq, and even international and small-cap indexes to get a more
complete picture.
Using the Dow as a Long-Term Motivation Tool
On the positive side, seeing how far the Dow has climbed over decades can be motivating. Long-term
charts show the index rising from double digits in its early days to tens of thousands of points in
modern times. That kind of growth, fueled by innovation, productivity, and compound returns, reminds
investors why staying invested over the long haul can be so powerful.
For many people, checking the Dow becomes less about day-to-day suspense and more about a periodic
reminder of progress. It’s like stepping on a scale that only updates every few months instead of every
five minutesless stressful, more meaningful.
Finding Your Own Balance with Market News
Perhaps the biggest experiential takeaway is learning how much attention to give the Dow in your daily
life. Some investors check it obsessively, reacting emotionally to every bump. Others ignore it
completely and focus only on their own plans. Most people eventually find a middle ground: they stay
informed, but they don’t let every headline drive their decisions.
Over time, the Dow becomes less of a scoreboard you live and die by and more of a background indicator:
useful, interesting, and historically importantbut just one piece of a much bigger financial puzzle.
Conclusion
The Dow Jones Industrial Average is one of the oldest and most iconic stock market indexes in the
world. It tracks 30 influential U.S. companies, offers a quick snapshot of blue-chip performance, and
gives us more than a century of historical context. At the same time, it has real limitations: a small
number of components, a price-weighted structure, and less comprehensive coverage than broader indexes
like the S&P 500.
If you understand what the Dow isand what it isn’tyou can use it wisely. Let it inform you, not
control you. Use it as a starting point, not the final answer. And remember: your long-term financial
success depends more on your savings habits, diversification, and discipline than on the Dow’s latest
200-point swing.