Table of Contents >> Show >> Hide
- What Is the P/E Ratio?
- Why Investors Use the P/E Ratio
- Trailing P/E vs. Forward P/E
- How To Use the P/E Ratio To Value a Stock
- What Is a Good P/E Ratio?
- When the P/E Ratio Works Best
- When the P/E Ratio Can Mislead You
- Metrics To Use Alongside the P/E Ratio
- A Simple Example of P/E-Based Valuation
- Final Thoughts
- Experience and Practical Lessons From Using the P/E Ratio
If stock valuation had a starter pack, the price-to-earnings ratio would be in it, probably front and center, wearing sunglasses, and acting like it owns the place. The P/E ratio is one of the first tools investors learn because it is simple, quick, and surprisingly useful. It tells you how much the market is willing to pay for each dollar of a company’s earnings. In plain English, it helps answer a very old Wall Street question: “Is this stock cheap, expensive, or just showing off?”
But here is the twist: the P/E ratio is helpful without being magical. It can point you in the right direction, but it cannot carry the whole analysis on its tiny mathematical shoulders. Used well, it can help you compare similar companies, spot market expectations, and think more clearly about valuation. Used badly, it can send you marching confidently into a bad decision while humming a victory song.
In this guide, we will break down how to use the P/E ratio to value a stock, when it works, when it lies by omission, and how smart investors pair it with other metrics before making a move.
What Is the P/E Ratio?
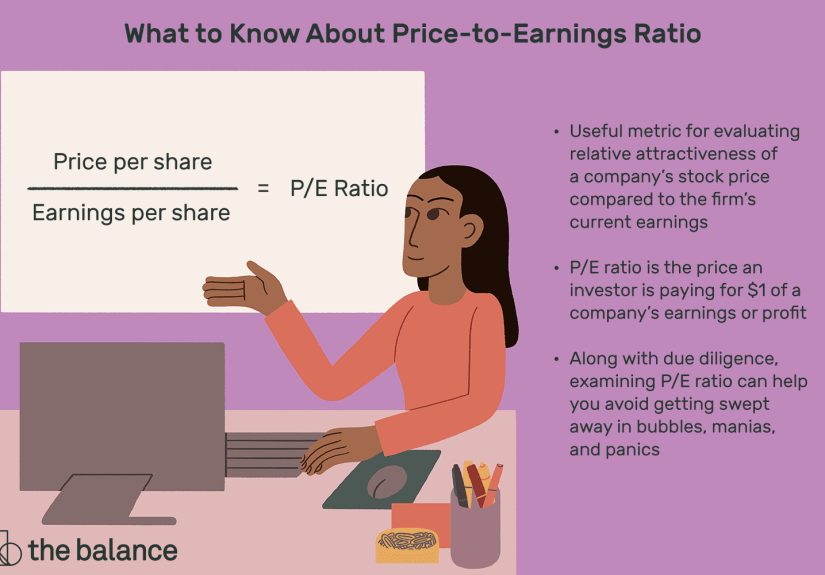
The P/E ratio, or price-to-earnings ratio, measures a company’s share price relative to its earnings per share, often called EPS. The formula is refreshingly straightforward:
P/E Ratio = Stock Price ÷ Earnings Per Share
Suppose a stock trades at $60 per share and its earnings per share over the last 12 months are $3. The P/E ratio is 20. That means investors are paying $20 for every $1 of earnings the company generated.
That number by itself is not automatically good or bad. A P/E of 20 might be cheap for one company, expensive for another, and completely normal for a third. Context matters. A lot. In investing, context is the difference between “promising opportunity” and “well, that was educational.”
Why Investors Use the P/E Ratio
The main appeal of the P/E ratio is that it turns a messy valuation discussion into something investors can compare quickly. It acts like a shortcut for market expectations. Higher P/E ratios often suggest that investors expect stronger future growth. Lower P/E ratios may indicate slower growth, higher risk, or a stock that the market has overlooked.
That is why the P/E ratio is so common in fundamental analysis. It gives investors a fast way to judge whether a stock’s current price looks reasonable relative to its profits. It also helps when comparing businesses in the same sector. If one company trades at 14 times earnings and another trades at 28 times earnings, you immediately know the market sees them very differently.
Of course, the market is not always right. Sometimes a high multiple reflects real quality. Sometimes it reflects hype wearing a nice suit. The job of the investor is to figure out which is which.
Trailing P/E vs. Forward P/E
Trailing P/E
Trailing P/E uses earnings from the past 12 months. This is the more objective version because it is based on results the company has already reported. The upside is that the earnings are real, not guesses. The downside is that the past is not always a reliable map of the future, especially if the business is changing quickly.
Forward P/E
Forward P/E uses projected earnings, usually for the next 12 months. This can be more useful if you are trying to value a company based on where it is going instead of where it has been. The problem is obvious: forecasts are still forecasts. Analysts are smart, but they are not fortune tellers. If expected earnings fall, that “cheap” forward P/E can suddenly look less charming.
Good investors often look at both. Trailing P/E tells you what the company has earned. Forward P/E tells you what the market expects. The gap between the two can reveal whether investors are anticipating rising profits, flat performance, or trouble ahead.
How To Use the P/E Ratio To Value a Stock
1. Compare it with direct competitors
The most useful way to apply the P/E ratio is to compare a company with similar companies in the same industry. Comparing a software company to a utility stock using P/E is like comparing a speedboat to a toaster. Both may be useful, but not for the same reason.
For example, imagine two retail companies with stable earnings. Company A trades at a P/E of 12, while Company B trades at a P/E of 22. If both have similar margins, growth rates, and debt levels, Company A may deserve a closer look as a potentially undervalued stock. But if Company B is growing revenue and earnings much faster, the premium may be justified.
2. Compare it with the company’s own history
A stock’s current P/E ratio means more when you compare it with its historical average. If a company usually trades around 18 times earnings and now trades at 12, something has changed. That change could be an opportunity, or it could be a warning sign. Your job is to find out which one you are looking at.
This method works especially well for mature businesses with relatively stable earnings. If the company has a long history of consistent profitability, its average valuation range can offer a helpful benchmark.
3. Compare it with expected growth
A low P/E ratio can look appealing until you realize the company’s earnings are barely growing. Meanwhile, a higher P/E may be justified if earnings are expected to rise sharply. This is why investors often pair the P/E ratio with the PEG ratio, which adjusts the P/E for earnings growth.
For instance, a stock trading at 30 times earnings might sound expensive, but if earnings are expected to grow 30% annually, the valuation may be more reasonable than it first appears. On the flip side, a stock trading at 10 times earnings may not be a bargain if earnings are shrinking.
4. Check earnings quality
Not all earnings are equally impressive. Sometimes net income gets a temporary boost from one-time events, accounting gains, or unusually favorable conditions. A stock can look cheap on a P/E basis simply because the “E” is inflated.
Before trusting the ratio, review whether earnings are consistent, recurring, and supported by cash flow. If profits look suspiciously polished, the P/E ratio may be giving you the financial version of a flattering selfie.
5. Look at the balance sheet
The P/E ratio ignores debt. Two companies with identical earnings and identical P/E ratios can carry very different financial risks if one is heavily leveraged. That is why investors often combine P/E analysis with debt ratios, return on equity, and enterprise-value-based measures such as EV/EBITDA.
Translation: do not let a neat little multiple distract you from a messy capital structure.
What Is a Good P/E Ratio?
This is one of the most common investing questions, and also one of the least satisfying to answer. There is no universal “good” P/E ratio. It depends on the industry, interest-rate environment, business quality, growth outlook, and overall market sentiment.
Growth companies often trade at higher P/E ratios because investors expect bigger future profits. Mature, slower-growing companies typically trade at lower multiples. Financial stocks, consumer staples, healthcare firms, and technology companies often sit in very different valuation ranges. That means a “high P/E stock” in one industry might look perfectly ordinary in another.
Instead of asking whether a P/E ratio is good in isolation, ask better questions:
- Is it low or high relative to peers?
- Is it low or high relative to the company’s history?
- Does the multiple make sense given the growth outlook?
- Are the earnings strong and dependable?
That is how valuation becomes analysis instead of numerology.
When the P/E Ratio Works Best
The P/E ratio tends to be most useful when analyzing established, profitable companies with steady business models. Think consumer brands, large industrial companies, insurers, banks, and other businesses where earnings are meaningful and relatively stable.
It also works well when you are screening for ideas. If you are reviewing a long list of stocks, the P/E ratio can quickly help you identify which names deserve deeper research. It is a bit like speed dating for equities, except with more spreadsheets and fewer awkward appetizers.
For value investors, the P/E ratio can be a practical starting point. A lower multiple may signal a stock that is out of favor, overlooked, or unfairly punished. But again, “starting point” is the key phrase. It is the opening scene, not the entire movie.
When the P/E Ratio Can Mislead You
Negative earnings
If a company has no earnings or negative earnings, the P/E ratio becomes meaningless or unavailable. That makes it less useful for early-stage growth companies, turnaround stories, and businesses going through a rough patch.
Cyclical businesses
For cyclical companies, such as manufacturers, commodity producers, or some transportation businesses, earnings can swing sharply depending on the economic cycle. A stock may look cheap at the top of the cycle when earnings are temporarily strong and look expensive at the bottom when earnings are depressed. In other words, the P/E ratio can tell the truth while still being wildly unhelpful.
Accounting distortions
Earnings can be shaped by accounting decisions, write-downs, tax events, and nonrecurring items. If the income statement is messy, the P/E ratio built on top of it can be messy too.
Ignoring cash flow and assets
The P/E ratio focuses on profits, not cash generation, asset value, or financial leverage. A business with great accounting earnings but poor cash flow may deserve a lower valuation than its P/E suggests. Likewise, companies with strong asset bases or unusually clean balance sheets may look better under other valuation methods.
Metrics To Use Alongside the P/E Ratio
If you want a more complete picture of stock valuation, pair the P/E ratio with other metrics:
- PEG ratio: Useful when growth matters.
- Price-to-book ratio: Helpful for financial firms and asset-heavy businesses.
- Price-to-sales ratio: Useful when earnings are weak or inconsistent.
- EV/EBITDA: Good for comparing firms with different debt levels.
- Free cash flow yield: Helps reveal whether profits are turning into real cash.
- Return on equity and operating margin: Useful for judging quality, not just price.
A stock is rarely attractive because of one number alone. The best investing decisions usually come from combining valuation, quality, growth, and risk into one sensible view.
A Simple Example of P/E-Based Valuation
Let’s say a company earns $5 per share and similar businesses in its sector trade at an average P/E ratio of 18. If this company has comparable growth, margins, and risk, a rough fair-value estimate might be:
Estimated Fair Value = $5 EPS × 18 = $90 per share
If the stock is trading at $72, it may be undervalued. If it is trading at $115, it may be overvalued. But before you celebrate your brilliance, check the assumptions. Maybe the company deserves a discount because of weaker growth or higher debt. Maybe it deserves a premium because it has a stronger brand, better management, or cleaner margins.
The P/E ratio gives you a practical framework, not a final verdict. It is a flashlight, not a crystal ball.
Final Thoughts
Using the P/E ratio to value a stock is one of the most practical ways to begin analyzing a company. It is simple enough for beginners, useful enough for experienced investors, and flexible enough to work across many sectors when used carefully. It can help you compare companies, judge market expectations, and estimate whether a stock price looks reasonable relative to earnings.
But the real secret is knowing what the P/E ratio cannot do. It cannot capture everything about growth, debt, cash flow, risk, or earnings quality. It cannot rescue a weak investment thesis. And it definitely cannot protect investors from overconfidence, which has probably cost more money than any bad spreadsheet ever could.
Use the P/E ratio as a starting point. Then ask sharper questions. Check the balance sheet. Study the growth outlook. Compare peers. Review cash flow. Put the number in context. That is how you turn a basic ratio into a smarter investing tool.
In the stock market, paying attention to valuation matters. Paying attention to valuation with context matters even more.
Experience and Practical Lessons From Using the P/E Ratio
One of the most common real-world experiences investors have with the P/E ratio is learning that “cheap” and “good value” are not the same thing. Many people, especially beginners, see a single-digit P/E ratio and assume they have discovered a hidden gem. Then they dig a little deeper and realize the company has weak demand, heavy debt, declining margins, or management guidance that sounds like a weather forecast before a hurricane. The lesson is memorable: a low multiple is only interesting when the business itself is still healthy.
Another frequent experience comes from watching high-P/E stocks keep climbing when logic says they should cool down. This usually happens with businesses that have strong brands, fast growth, expanding margins, or a market position investors love. A stock at 35 or 40 times earnings can look absurdly expensive right up until profits rise enough to support the valuation. Investors who rely only on the headline P/E may miss why the market is willing to pay up for quality and growth. That can be a humbling moment, but also a useful one.
Experienced investors often say the P/E ratio becomes more helpful after you have seen it fail a few times. For example, in cyclical industries, a company can look cheapest right before earnings drop. That happens because the “E” in the ratio is based on temporarily elevated profits. An investor who buys solely because the P/E looks low may later discover that the company was not undervalued at all. It was simply near the top of a business cycle. That experience teaches an important habit: always ask whether current earnings are normal, inflated, or depressed.
There is also the opposite case. Sometimes a stock looks expensive on a P/E basis during a temporary slump because earnings are unusually weak. Investors who understand the business cycle may recognize that the company is actually attractive before the rebound shows up in the numbers. This is one reason professional investors rarely use the P/E ratio in isolation. They want to know whether the earnings figure reflects normal operations or a temporary distortion.
Practical investing experience also shows that P/E ratios are most powerful when combined with a repeatable process. Many investors build a simple checklist: compare the stock’s current P/E with peers, review the five-year average, check forward earnings estimates, scan free cash flow, and look at debt. That process does not eliminate mistakes, but it reduces lazy ones. And in investing, avoiding lazy mistakes is a respectable superpower.
Perhaps the most valuable lesson is psychological. The P/E ratio feels precise, and precision can create false confidence. Seeing a stock trade at 14 times earnings instead of 19 times earnings makes the decision seem scientific. But valuation is part math, part judgment, and part accepting that the future will not always cooperate. Investors who do best with the P/E ratio tend to use it with curiosity, not certainty. They treat it as an invitation to investigate, not as permission to stop thinking.
In that sense, the real experience of using the P/E ratio is less about memorizing a formula and more about developing better instincts. Over time, you learn when a multiple reflects fear, when it reflects excitement, and when it reflects business quality. That is when the ratio becomes genuinely useful. Not because it predicts the future perfectly, but because it helps you ask smarter questions before you risk real money.